This is a contradiction! The inter market relationship between Treasuries and stocks has been an inverse one since 1997. Whenever we have seen this anomaly, Treasuries were portending weakness in stocks. We saw this in early 2011 on a shorter term basis. However, this time we are seeing a sustained contradiction which I expect to continue. Could Treasuries be wrong this time and stocks right? Anything is possible but the odds speak against it.
HT +Marc Chandler corrected my statement regarding the inverse correlation between Treasuries and stocks since q997. He rightl pointed out that, based on 26 week correlations, prior to GFC, the correlation was generally positive. My point was that since the Asian Currency crisis investors have generally fled into Treasuries in volatile periods.
Friday, July 8, 2016
Sunday, May 3, 2015
Head Fake or Signal
Copper, German Bund yields and the US Ten Yr yield surged in tandem on Thursday. This is either the head fake of all time or a clear signal that the global economy strengthening. I've been more bullish than most on stocks and the global economy and this is just another signal we are finally on our way out of the global economic malaise.
Europe and Emerging Markets will continue to outperform US equities but the S&P 500 will still be at all time highs by the end of year.

In the meantime, we're still in for a bumpy ride as seasonal factors will keep the market choppy through the first part of summer (at least) and issues regarding Greece and ongoing fears of when and how much the Fed will raise interest rates still grip the market. All these, in my opinion, are unwarranted concerns.
Have a great week!
The statements, opinions and projections made in this writing are for informational purposes and are my own. They do not represent the views of my broker/dealer. Additionally, this writing does not constitute an offer to sell, a solicitation to buy, or a recommendation regarding any securities transaction, or as an offer to provide advisory or other services by me or my broker/dealer in any jurisdiction in which such offer, solicitation, purchase or sale would be unlawful under the securities laws of such jurisdiction.
Warning! you can lose some or all of your principal (money) investing in stocks, bonds, ETFs, mutual funds, currencies, indexes, index or stock options, LEAPS and stock or commodity futures!
Europe and Emerging Markets will continue to outperform US equities but the S&P 500 will still be at all time highs by the end of year.
(Click on chart for larger image)
In the meantime, we're still in for a bumpy ride as seasonal factors will keep the market choppy through the first part of summer (at least) and issues regarding Greece and ongoing fears of when and how much the Fed will raise interest rates still grip the market. All these, in my opinion, are unwarranted concerns.
Have a great week!
The statements, opinions and projections made in this writing are for informational purposes and are my own. They do not represent the views of my broker/dealer. Additionally, this writing does not constitute an offer to sell, a solicitation to buy, or a recommendation regarding any securities transaction, or as an offer to provide advisory or other services by me or my broker/dealer in any jurisdiction in which such offer, solicitation, purchase or sale would be unlawful under the securities laws of such jurisdiction.
The information contained in this writing should not be construed as financial or investment advice on any subject matter. This writing is not published for the purpose of utilizing the information for short term trading or long term investing in stocks, bonds, ETFs, mutual funds,currencies, indexes, index or stock options, LEAPS, and stock or commodity futures. I expressly disclaim all liability in respect to actions taken based on any or all of the information on this writing. Seek the personal, face to face guidance of a registered investment advisor before entering any trade or investment. Anyone who trades or invests based on the information in this commentary does so at his/her own risk.
Warning! you can lose some or all of your principal (money) investing in stocks, bonds, ETFs, mutual funds, currencies, indexes, index or stock options, LEAPS and stock or commodity futures!
Saturday, April 11, 2015
Global growth stirring!
While I haven't posted a commentary in over six weeks the stock market has experienced volatility not seen in a few years as investors remain fretful of the Fed normalizing interest rate policy, a volatile crude oil market, a "Grexit" or Greek exit from the Eurozone (a farcical drama) and concerns that the US economy might be actually slowing. My post this weekend will be brief but I intend to present a thesis on why we are in the midst of a turn in world economic growth and that global equities will move significantly higher in 2015; perhaps higher than many consensus forecasts on Wall Street.


To sum up, with a Federal Reserve tentative about raising short term rates, the ECB and BoJ (Bank of Japan) flooding the global system with liquidity, muted inflationary pressures and expectations and an interest rate environment very conducive to borrowing for capital growth, equities have nowhere to go but higher. A twenty five or even fifty basis point rise in short term rates is not going to ruin the party. Yellen predicates any move on interest rates as data dependent. So, as it stands right now, if the Fed goes this year it will be in September and with only one bump of twenty five basis points.
The statements, opinions and projections made in this writing are for informational purposes and are my own. They do not represent the views of my broker/dealer. Additionally, this writing does not constitute an offer to sell, a solicitation to buy, or a recommendation regarding any securities transaction, or as an offer to provide advisory or other services by me or my broker/dealer in any jurisdiction in which such offer, solicitation, purchase or sale would be unlawful under the securities laws of such jurisdiction.
Warning! you can lose some or all of your principal (money) investing in stocks, bonds, ETFs, mutual funds, currencies, indexes, index or stock options, LEAPS and stock or commodity futures!
To say I have long term concerns is both true and, in a sense, self serving. No one with the potential readership I have does not try to "hedge his bets". And in the case of the global economy, there are genuine issues that must give long term investors reason for pause:
- Structural issues in the Eurozone which won't go away simply because the European Central Bank (ECB) is pumping 60 billion euros a month into the system
- The fact that the ECB QE program may run out of "debt paper" to buy as they are constrained in buying bonds with negative yields. The Eurozone is quickly becoming a negative yield bond market.
- Runaway Japanese money printing in their attempt to finally turn the tide against two decades of deflation which is inflating their equity market (ditto China)
- The "hiccup" in US economic growth which, with every passing day, is looking more and more solely weather related
- The impact of falling oil prices on leveraged debt in and around the oil and NATGAS industry
And this is all good! Because when everyone has concerns the market "climbs the wall of worry" and moves higher. It's when investors get complacent that it's time to watch out. And I will be giving an example of this complacency relating to another matter toward the end of my commentary.
The first three concerns I mentioned are actually a double edged sword. Although they are distortions that have been created by central bank manipulation they are also the reason why global growth and equities are preparing to move another significant leg higher in the coming months.
In the wake of the 2008 debacle, central banks have inflated risk assets in the hopes that eventually asset prices would spur broader economic growth thru capital investment, thereby generating employment and overall prosperity. Papering over trillions of dollars in lost wealth and debt was an experiment that was forced on central banks. To do nothing would have been to invite a deflationary depression which would have made the early 1930's seem mild. In a post 2008 world the central bank experiment has generated up to this point, only tepid and uneven growth. There are many factors that have contributed to this fact which are outside the scope of this commentary but which I've touched upon is past writings.
In my last commentary I stated that, at a macro level, the consuming economies in the West would have to lead us out of this global economic malaise we find ourselves in before we could start to see a significant pick up in economic activity in the developing nations of Asia and the Mid East. Simply, until Emerging Markets and China transitioned into true consuming economies, it was dependent on the West (US & Europe) to pull us out of this low growth, disinflationary to deflationary mire we find ourselves in. I've also specified that with ECB QE being implemented, we would start to see global growth accelerate around mid year. Well the Emerging Market complex seems to be giving us that signal already. Let me explain.
Many folks on the street have been concerned that as the US Dollar continues to rise, US Dollar denominated debt gets more expensive to pay off and emerging market countries, as a whole, are over exposed to US Dollar denominated debt. The following chart illustrates the problem:
(click on chart for larger image)
This has been a major concern of mine since the Dollar started its rise last year and, at first, emerging market stocks did not respond well to the Dollar's rise. And that made sense given the predominant inter market relationships prevalent in the financial markets. However, in the past few weeks Emerging Market stocks have made a huge move to the upside. Most analysts attribute the move to the spillover from the ongoing parabolic rally in Chinese mainland stocks. But that's nonsense in my opinion. China has singular issues that, at a macro level, have to do with excess capacity and demographic skew due to their decades long "one child" policy. The rally in China has everything to do with government stimulus, a change in trading regulations allowing many more investors to enter the market, and a shift way from real estate as the investment "du jour" to equities. However, I believe EM stocks, rallying in the face of a strong US Dollar, are signaling a return to normalcy that we have not seen since the 1990's. Here's a weekly chart of the MSCI iShares Emerging Market ETF (EEM):
(click on chart for larger image)
I want my readers to notice the correlation coefficient in the panel above the chart. EEM is in the midst of a strong rally while facing a strengthening US Dollar! So much for US Dollar denominated debt being an anchor around emerging market economies!
In the chart above, the previous rise in 2014 in which emerging markets rallied with a positive correlation to the Dollar ceased when the Fed officially ended their QE program. Emerging Markets reacted as they had in the past to a strengthening dollar. But now the rise is accompanied by global expectations that the Fed will raise short term rates this year.
In the chart above, the previous rise in 2014 in which emerging markets rallied with a positive correlation to the Dollar ceased when the Fed officially ended their QE program. Emerging Markets reacted as they had in the past to a strengthening dollar. But now the rise is accompanied by global expectations that the Fed will raise short term rates this year.
If this signal persists it can only mean that the market is pricing in true and sustained global economic growth. In a post 2008-2009 world, there is no way that a sustained strengthening US Dollar could coexist with strong Emerging Market growth. The only way this can be occurring is by the economic paradigm changing.
Here's another curve ball I'd like to throw my readers. I made a statement above about investor complacency that I'd like to tie in with another situation that I believe may be brewing.
My "mantra" since I've been writing these commentaries (2010) is that the global economy was being held captive to gargantuan deflationary forces and that this was the battle that central banks and governments had to fight. In a world who's population had been steeped in an inflationary mindset, this view was often met with a quizzical glance or outright objections. However, in the past few months, in my capacity as an investment and financial advisor, almost everyone I meet is willing to admit that deflation is the real battle and that inflation is not the present enemy. Interestingly, the change in attitudes has coincided with a stirring. Here's a weekly chart of the SPDR Gold Trust Shares (GLD):
(click on chart for larger image)
Admittedly, I have to embrace the fact that technically Gold is in a down trend and with the prospect of higher interest rates (even if incremental) there should be more downside pressure on the yellow metal. And the price action in mining stocks do not support a move higher either. However, if the move in Emerging Markets is more than the anomaly I think it is, then in the same technical environment, would Gold not rally in tandem with a strengthening dollar? Some of my friends may giggle that I am even suggesting that a strong Dollar and Gold could be positively correlated but if the move in EM is sustained then inflationary pressures could mount globally as economies in both the developed and developing world start to fire on all pistons.
To sum up, with a Federal Reserve tentative about raising short term rates, the ECB and BoJ (Bank of Japan) flooding the global system with liquidity, muted inflationary pressures and expectations and an interest rate environment very conducive to borrowing for capital growth, equities have nowhere to go but higher. A twenty five or even fifty basis point rise in short term rates is not going to ruin the party. Yellen predicates any move on interest rates as data dependent. So, as it stands right now, if the Fed goes this year it will be in September and with only one bump of twenty five basis points.
Have a great week!
The information contained in this writing should not be construed as financial or investment advice on any subject matter. This writing is not published for the purpose of utilizing the information for short term trading or long term investing in stocks, bonds, ETFs, mutual funds,currencies, indexes, index or stock options, LEAPS, and stock or commodity futures. I expressly disclaim all liability in respect to actions taken based on any or all of the information on this writing. Seek the personal, face to face guidance of a registered investment advisor before entering any trade or investment. Anyone who trades or invests based on the information in this commentary does so at his/her own risk.
Warning! you can lose some or all of your principal (money) investing in stocks, bonds, ETFs, mutual funds, currencies, indexes, index or stock options, LEAPS and stock or commodity futures!
Sunday, February 22, 2015
Money moves into Europe!
Since my last commentary the market has been pushed to and fro with concerns over a Greek exit from the Euro Zone and with Friday's "agreement" in Brussels it appears that the Greek saga has been pushed back another four months when another day of reckoning will rear it's ugly head.
Monday will tell us much regarding the Tsipras' government's resolve to stay in the zone when they submit their list of alternative reform measures to the EU. If there's any fudging on the Greek government's part to dodge the general thrust of the austerity measures originally imposed upon them, it will be back to the drawing board once again and more market volatility will result. Still, the market has been very resilient throughout the negotiation saga of the past few weeks and I believe any market moves will be muted.
In my opinion, the two biggest concerns market players have at this point is the uncertain ramifications of a Greek exit from the EU and the risk of contagion as other separatist movements on the European continent might be emboldened to instigate a break away from the EU. While I don't see the latter as a significant risk, the uncertainty of the former is creating market volatility. However,Greece is the only sovereign "basket case" in the Euro zone and a "Grexit" (Greece leaving the EU) is still a very small probability. The Tsipras government is playing a game of chicken ...

... which they cannot win and if the ECB withdraws their support from Greek banks it would immediately result in abject destitution for the Greek nation and spawn a humanitarian crisis of huge proportions.
In the meantime, there continues to be glimmers of reflation in the Euro zone. Here's just one example. Italy and Spain, two nations which have struggled since 2008, are turning up:

For instance, oil looks like it has found a floor and even after a disappointing report on Friday where the reduction of US rig counts was lower than expected, "black gold" was remarkably resilient. Many traders (and I) expected a much more severe sell off and it seems like West Texas Crude has some support at $50/barrel:


The statements, opinions and projections made in this writing are for informational purposes and are my own. They do not represent the views of my broker/dealer. Additionally, this writing does not constitute an offer to sell, a solicitation to buy, or a recommendation regarding any securities transaction, or as an offer to provide advisory or other services by me or my broker/dealer in any jurisdiction in which such offer, solicitation, purchase or sale would be unlawful under the securities laws of such jurisdiction.
Warning! you can lose some or all of your principal (money) investing in stocks, bonds, ETFs, mutual funds, currencies, indexes, index or stock options, LEAPS and stock or commodity futures!
Monday will tell us much regarding the Tsipras' government's resolve to stay in the zone when they submit their list of alternative reform measures to the EU. If there's any fudging on the Greek government's part to dodge the general thrust of the austerity measures originally imposed upon them, it will be back to the drawing board once again and more market volatility will result. Still, the market has been very resilient throughout the negotiation saga of the past few weeks and I believe any market moves will be muted.
In my opinion, the two biggest concerns market players have at this point is the uncertain ramifications of a Greek exit from the EU and the risk of contagion as other separatist movements on the European continent might be emboldened to instigate a break away from the EU. While I don't see the latter as a significant risk, the uncertainty of the former is creating market volatility. However,Greece is the only sovereign "basket case" in the Euro zone and a "Grexit" (Greece leaving the EU) is still a very small probability. The Tsipras government is playing a game of chicken ...
Cartoon courtesy of SoberLook
@soberlook
... which they cannot win and if the ECB withdraws their support from Greek banks it would immediately result in abject destitution for the Greek nation and spawn a humanitarian crisis of huge proportions.
In the meantime, there continues to be glimmers of reflation in the Euro zone. Here's just one example. Italy and Spain, two nations which have struggled since 2008, are turning up:
Chart courtesy of SoberLook
@SoberLook
Other economic indicators (credit growth and expanding money supply) are giving significant support to international equity and commodity valuations.
For instance, oil looks like it has found a floor and even after a disappointing report on Friday where the reduction of US rig counts was lower than expected, "black gold" was remarkably resilient. Many traders (and I) expected a much more severe sell off and it seems like West Texas Crude has some support at $50/barrel:
(click on chart for larger image)
This weekly chart clearly shows the strong bounce in the area I earlier marked as "potential drop zone" and we are now at the top of another resistance area. My thesis on oil's recent bounce in the face of gross oversupply and static demand is market expectations that Europe is now stirring we are going to start to see some measurable global economic growth which will increase demand for oil.
Whether oil's bounce and recent positive economic reports out of the EU (as unbalanced as they are) are more than "head fakes" only time will tell but there's no question that cheap oil and a weak Euro are starting to produce some growth in Europe and is gaining the attention of market participants. We may be starting to see a rotation out of US equities and into European shares as the chart below shows:
(click on chart for larger image)
This is a weekly chart of the Dow Jones Europe 600 Index, a broad based index of European stocks and I want my readers to notice the price relative chart in the bottom panel. After a long downtrend, European stocks have jumped and are, at least for now, outperforming their US counterparts. I believe this explains, in part, the relatively sluggish nature of the advance of US equities as money flows are starting to move out of the US into continental stocks.
The beginning of a rotation into European equities may explain why US stocks seem lethargic at these levels and I was thinking there might be a global rotation going on but not so in Emerging Markets:
(click on chart for larger image)
This is a weekly chart of the iShares MSCI Emerging Markets ETF (EEM) and the price relative chart to the S&P500 in the bottom panel is showing continued under performance. We do see some glimmers in momentum in the top panel (red arrow) where MACD is undergoing a possible crossover while the ETF itself is snagged on Fibonacci resistance.
I consider the price action in EEM logical given present conditions in the global economy. I have said more than a few times in past commentaries that, at a macro level, the consuming economies in the West will have to lead us out of this global economic malaise we find ourselves in before we can start to see a significant pick up in economic activity in the developing nations of Asia and the Mid East. Simply, until Emerging Markets and China transition into true consuming economies, it is dependent on the West (US & Europe) to pull us out of this low growth, disinflationary to deflationary mire we find ourselves in. There's much more to say on this topic as I believe that, at a foundational level, global economic challenges are structural in nature mainly based on demographics. However, I neither have the time or the inclination to comprehensively address this issue at this time.
Here in the US, stocks continue higher with unimpressive momentum as can be seen in a daily chart of the Wilshire 5000 Index below. All the major averages saw all time highs again on Friday but we're starting to see that rounding top action which usually presages either a "garden variety" correction or a consolidation:
(click on chart for larger image)
This is a daily chart of the Wilshire 5000 which is the entire US stock market. US stocks managed to break out of a trading range (green highlight) that started right around the first of the year on what I consider unimpressive momentum. We'll see if the market can sustain the breakout and Friday's candlestick was a positive but my intuition tells me we may not maintain these levels in the short term. I suspect we'll retrace Friday's price action back below the break out (brown line) on Monday.
When all is told, the markets are generally moving true to their inter market relationships. Part of oil's bounce and the possible ascent of US stocks can be traced to what is at least a consolidation in the US Dollar. Below is a chart of the Powershares DB US Dollar Bullish Index Fund (UUP) which is a popular trading vehicle if you don't want to trade the currency directly:
(click on chart for larger image)
The dollar is forming a less than perfect bullish ascending triangle which usually means a break out to new highs. However, the Relative Strength Indicator (RSI) in the top panel has weakened considerably which makes me think the dollar could fall out of the triangle to the downside. This would be a catalyst for equities and commodities in the short term and would serve to mitigate disinflationary and deflationary pressures in the global economy.
In my last commentary I made much of the price action of Treasuries in determining general market direction. Well, if rates are any indication, this market is moving higher:
(click on chart for larger image)
Here's an update of a chart I've posted many times before of the Ten Year Treasury yield. Since February 2nd, the yield has backed up almost 45 basis points(green highlight)! Treasuries are telling us that while rates are still incredibly low, economic growth is gaining momentum. Now, we've seen this movie before so I wouldn't be surprised if this is a "head fake" and a trend line I drew on the chart above shows we haven't broken trend yet but the spike in yield in a few weeks is impressive.
Much of the action in the Treasury market is the result of participants trying to discern when the Fed will commence raising short term interest rates. While some are targeting June others are targeting September and still others are targeting 2016. My view is that it will happen later rather than sooner. Everyone expecting a June lift off points to the seemingly excellent employment reports we have been seeing. And I know this is anecdotal, but I don't know anyone who lost a job in 2008 who, if they found a job, is making more money than in the job they previously lost and I don't know anyone who's pulling down annual raises that are meeting even the lowest inflation levels we are experiencing. If the employment reports were threatening an overheating economy we would be seeing inflationary expectations rising. And we're not:
(click on chart for larger image)
This is the TIP:IEF ratio which is a measure of the market's expectation of where inflation is going. I have posted a more detailed explanation of how the ratio works in past commentaries but for now, if the ratio is rising inflationary expectations are gaining steam and if the ratio is dropping, disinflationary to deflationary expectations are taking over. I highlighted where we are now in (green) and we've just bounced in the last few weeks after a sustained descent that started in July 2014. The bounce can be explained by the recent comeback in the price of oil as anything else.
Summing up, I'm constructive on equities going into mid year with a possible slowdown in the next month. The Treasury market is telling us that Greece is a non event and that global economic growth is turning positive. If we get some continued traction in the Euro zone we could be setting up for another banner year in equities. But as I've harped on in previous commentaries, Europe is the key to the global economy truly turning the corner. Certainly, there appears to be movement into European stocks as evidence that the reflation trade is starting to take hold over there. I'll be watching for signs of life in Emerging Markets next.
Have a great week!
The information contained in this writing should not be construed as financial or investment advice on any subject matter. This writing is not published for the purpose of utilizing the information for short term trading or long term investing in stocks, bonds, ETFs, mutual funds,currencies, indexes, index or stock options, LEAPS, and stock or commodity futures. I expressly disclaim all liability in respect to actions taken based on any or all of the information on this writing. Seek the personal, face to face guidance of a registered investment advisor before entering any trade or investment. Anyone who trades or invests based on the information in this commentary does so at his/her own risk.
Warning! you can lose some or all of your principal (money) investing in stocks, bonds, ETFs, mutual funds, currencies, indexes, index or stock options, LEAPS and stock or commodity futures!
Saturday, February 7, 2015
The Message of Treasuries
This is my first post in three weeks and it will be a shorter commentary than most. Equities have been dealing with some major issues which have been creating considerable volatility:
1. Oil prices
2. Events in the Eurozone, particularly Greece
3. Concern a stronger US Dollar will have on earnings
4. Ongoing disinflationary and deflationary pressures in the global economy.
The stock market tends to be a much more emotional market than the global bond and currency markets. What I mean is that one may glean much better directional signals for stocks by watching currencies and bonds. These two markets are the "dog that wags the tail (stocks)". And it's these two markets, particularly bonds, which I'm going to focus on in this brief commentary.
But first, here's where US stocks are as measured by the S&P 500:

I've highlighted the widely identified triple bottom everyone is talking about as well as what is looking like a triple top (thick purple dashed line) that repelled the S&P on Friday, February 6th (blue arrow). We're clearly in a trading range but what's notable is that the S&P 400 Mid cap Index made a new all time high on Thursday, February 5th and Small Caps as measured by the Russell 2000 and the S&P 600 Small Cap Index are outperforming their large cap brethren in the S&P 500. This is a sign of internal market strength and a reflection of the market's perception that large caps, most of which have international exposure, will be negatively impacted to some extent by a stronger US Dollar.
There has been much concern and market volatility over Greece and the new leftist government under Alexis Tsipras and their avowed pledge to gain debt relief from the EU and ECB. The situation is rather complex and I won't get into the fundamentals other than to say that if Greece thinks it's having a tough time now in the EU, they should consider that they will be far worse off if they ever left the union. But this is all a moot point because they're not leaving. At least that's what the US Treasury market is telling us with this week's price action. Yields spiked this week with some good US economic numbers and if there was truly a serious probability of Greece upsetting the global economy "apple cart", the "flight to safety trade" would have prevented the spike;

The daily chart above details the yield on the Ten Year US Treasury Note and it gives a history of the Ten Year yield going back to 2008. As can be seen, yields are still at historic lows for reasons I've articulated many times in past commentaries but my point is that the spike in yield highlighted above with the black arrow tells me there's no fear over any issues related to Greece. If things get dangerous over there you will see this yield and all yields along the Treasury yield curve drop like a rock. Then you can start worrying!
I've detailed in previous commentaries how the US Treasury yield curve has been flattening which is usually predictive of weaker economic growth and in looking at the chart below that trend is still intact. But this week's yield action (black arrows) might be an early indicator that this might be changing. This is a chart of the Ten Year Yield (green line) and the Two Year Yield (red line):

Analysis
The Treasury market is telling us there is no fear in the global financial system. The bounce we got in oil prices over the past week has helped to stabilize equities as disinflationary trends have been mitigated (at least for now).
Inter market relationships are by no means definitive at this point as certain markets are moving according to their respective supply/demand fundamentals (oil), while Gold is more in inverse "lockstep" with the US Dollar. Stocks and the US Dollar have been generally positively correlated for some months now which is signalling a continuation of normalcy: the value of a nation's currency is in direct proportion to it's economic and financial health.
If someone had asked me a week ago where stocks were headed I would have told them that there was a good chance we were lining up for a serious correction. But the Treasury market and the charts above tell me that is not in the cards. Still, there will need to be a catalyst to shake stocks out of their obvious trading range in the first chart above. Perhaps, Greece and the EU settling their differences could provide such a catalyst for stocks.
So, watch Treasuries! They will tell us where equities are going.
Have a great week!
The statements, opinions and projections made in this writing are for informational purposes and are my own. They do not represent the views of my broker/dealer. Additionally, this writing does not constitute an offer to sell, a solicitation to buy, or a recommendation regarding any securities transaction, or as an offer to provide advisory or other services by me or my broker/dealer in any jurisdiction in which such offer, solicitation, purchase or sale would be unlawful under the securities laws of such jurisdiction.
Warning! you can lose some or all of your principal (money) investing in stocks, bonds, ETFs, mutual funds, currencies, indexes, index or stock options, LEAPS and stock or commodity futures!
1. Oil prices
2. Events in the Eurozone, particularly Greece
3. Concern a stronger US Dollar will have on earnings
4. Ongoing disinflationary and deflationary pressures in the global economy.
The stock market tends to be a much more emotional market than the global bond and currency markets. What I mean is that one may glean much better directional signals for stocks by watching currencies and bonds. These two markets are the "dog that wags the tail (stocks)". And it's these two markets, particularly bonds, which I'm going to focus on in this brief commentary.
But first, here's where US stocks are as measured by the S&P 500:
(click on chart for larger image)
I've highlighted the widely identified triple bottom everyone is talking about as well as what is looking like a triple top (thick purple dashed line) that repelled the S&P on Friday, February 6th (blue arrow). We're clearly in a trading range but what's notable is that the S&P 400 Mid cap Index made a new all time high on Thursday, February 5th and Small Caps as measured by the Russell 2000 and the S&P 600 Small Cap Index are outperforming their large cap brethren in the S&P 500. This is a sign of internal market strength and a reflection of the market's perception that large caps, most of which have international exposure, will be negatively impacted to some extent by a stronger US Dollar.
There has been much concern and market volatility over Greece and the new leftist government under Alexis Tsipras and their avowed pledge to gain debt relief from the EU and ECB. The situation is rather complex and I won't get into the fundamentals other than to say that if Greece thinks it's having a tough time now in the EU, they should consider that they will be far worse off if they ever left the union. But this is all a moot point because they're not leaving. At least that's what the US Treasury market is telling us with this week's price action. Yields spiked this week with some good US economic numbers and if there was truly a serious probability of Greece upsetting the global economy "apple cart", the "flight to safety trade" would have prevented the spike;
(click on chart for larger image)
The daily chart above details the yield on the Ten Year US Treasury Note and it gives a history of the Ten Year yield going back to 2008. As can be seen, yields are still at historic lows for reasons I've articulated many times in past commentaries but my point is that the spike in yield highlighted above with the black arrow tells me there's no fear over any issues related to Greece. If things get dangerous over there you will see this yield and all yields along the Treasury yield curve drop like a rock. Then you can start worrying!
I've detailed in previous commentaries how the US Treasury yield curve has been flattening which is usually predictive of weaker economic growth and in looking at the chart below that trend is still intact. But this week's yield action (black arrows) might be an early indicator that this might be changing. This is a chart of the Ten Year Yield (green line) and the Two Year Yield (red line):
(click on chart for larger image)
Analysis
The Treasury market is telling us there is no fear in the global financial system. The bounce we got in oil prices over the past week has helped to stabilize equities as disinflationary trends have been mitigated (at least for now).
Inter market relationships are by no means definitive at this point as certain markets are moving according to their respective supply/demand fundamentals (oil), while Gold is more in inverse "lockstep" with the US Dollar. Stocks and the US Dollar have been generally positively correlated for some months now which is signalling a continuation of normalcy: the value of a nation's currency is in direct proportion to it's economic and financial health.
If someone had asked me a week ago where stocks were headed I would have told them that there was a good chance we were lining up for a serious correction. But the Treasury market and the charts above tell me that is not in the cards. Still, there will need to be a catalyst to shake stocks out of their obvious trading range in the first chart above. Perhaps, Greece and the EU settling their differences could provide such a catalyst for stocks.
So, watch Treasuries! They will tell us where equities are going.
Have a great week!
The statements, opinions and projections made in this writing are for informational purposes and are my own. They do not represent the views of my broker/dealer. Additionally, this writing does not constitute an offer to sell, a solicitation to buy, or a recommendation regarding any securities transaction, or as an offer to provide advisory or other services by me or my broker/dealer in any jurisdiction in which such offer, solicitation, purchase or sale would be unlawful under the securities laws of such jurisdiction.
The information contained in this writing should not be construed as financial or investment advice on any subject matter. This writing is not published for the purpose of utilizing the information for short term trading or long term investing in stocks, bonds, ETFs, mutual funds,currencies, indexes, index or stock options, LEAPS, and stock or commodity futures. I expressly disclaim all liability in respect to actions taken based on any or all of the information on this writing. Seek the personal, face to face guidance of a registered investment advisor before entering any trade or investment. Anyone who trades or invests based on the information in this commentary does so at his/her own risk.
Warning! you can lose some or all of your principal (money) investing in stocks, bonds, ETFs, mutual funds, currencies, indexes, index or stock options, LEAPS and stock or commodity futures!
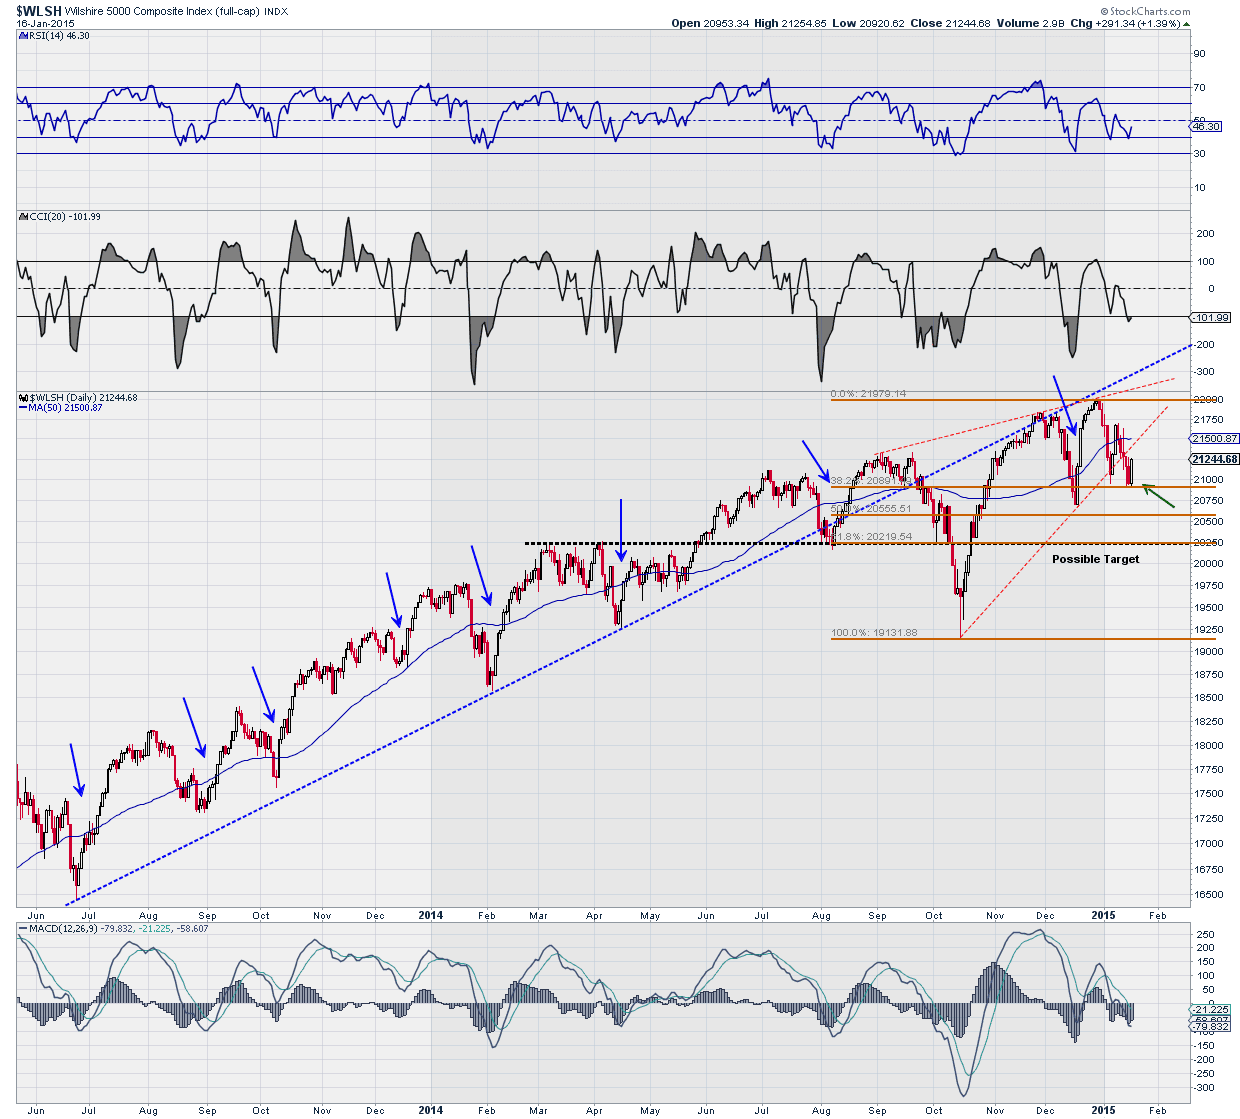
Saturday, January 17, 2015
Big week! Outcomes & Consequences
We've seen quite a bit of volatility in all markets in the past two weeks and much of it has been primarily the result of the radical slide in oil prices which consumers are loving but oil producers and their creditors aren't. Here's an update of the chart I posted two weeks ago of the Wilshire 5000 which is the entire US stock market:


The major event that will have an impact on stocks for at least the first half of this year is the upcoming ECB meeting on January 22nd. It is widely expected that the outcome of the meeting will be a significant policy change so that policymakers can stave off the deflationary spiral that is threatening the Euro zone. But deflation is already there:

The ECB's goal is to expand their balance sheet to a trillion euros. So far, they have calculated that by buying covered bonds and ABS (asset backed securities) they can expand the balance sheet to maybe 450 billion euros. The market is expecting an announcement where they will commit to purchasing $500 billion in sovereign bonds in the secondary market.
This is hardly the "shock and awe" that accompanied both the US and Japanese QE efforts. And there in lies the concerns market participants are starting to have and has been, in my opinion, an attendant reason for the market volatility the past few weeks.
First of all, there's a possible chance that there will be no announcement on Thursday, the 22nd. ECB President Mario Draghi made that clear in his last press conference. The announcement could come in June. But the chart above speaks for itself and, like inflation, waiting will only exacerbate the deflationary spiral. Many are arguing that it may already be too late to stem the tide.
Secondly, there is the important argument surrounding how effective sovereign bond purchases would be. Yields are already so low that the benefits in attempting to push them lower may not be worth it and may create other significant distortions that make the effort dangerous. After all, if the ECB buys the debt, who holds it? This is an ongoing debate in the ECB governing council and rumors persist that while the ECB will implement the policy the national banks will hold the debt. But in a deflationary environment national banks take on a dangerous exposure if the bond buying does not accomplish the goal of reflation. And then there's always the moral risk associated with these purchases which is behind the Germans main objection to this proposal.
Behind the German concerns and a huge part of the problem is the quiet recognition in the Euro area that monetary policy can only go so far in "kick starting" a recessionary economy and that fiscal policy must take over. But there is no will in the Euro zone, either among the Italians, French or the Germans to confront this issue. I cite in defense of this position the recent submission of France's national budget to the EU which was over the mandatory 3% deficit threshold. The result is that they went into "negotiations" with the EU on this budget and the whole issue was essentially glossed over.
I understand that issues are much more complex than stated above but these events underline the deeply flawed concept behind the EMU (European Monetary Union). Monetary union without fiscal/political union is untenable.
And so the Germans, which are the deep pockets over there, don't want to get caught holding the bag. And they have significant political sway in the ECB although they can be overruled.
So, whatever is announced on Thursday (if it is announced) is more likely to disappoint the market than to encourage it. Certainly a "shock and awe" surprise would be met with frenzied buying in the equity markets but no rational person can expect this outcome.
It's difficult to speculate the market reaction, especially with the focus on the price of oil (another deflationary beacon notwithstanding arguments that it's about oversupply). But I now believe the best outcome will be for the market to take the announcement in stride unless they postpone their decision.
If they postpone the decision things will probably get ugly. If they come in with $500 billion in sovereign purchases we're liable to see a rally but not of the magnitude I previously had predicted. After all, as stated above, they're at the point where they are confronting diminishing returns unless they go "all out"; buying anything and everything they can in the bond and debt markets. And for reasons stated above, they will not do that.
However, the market is wiser than any individual or entity engaged in it and anything can happen. The fact that inter market relationships are getting tricky and that emerging markets have been resilient in the face of significant volatility is encouraging to me.
There are also issues going on in Greece that I'm not too concerned with at this time but which must be watched. And it is becoming more apparent that the Fed's anticipated interest rate increases will be postponed until later in the year? Remember "Liquidity Traps Revisited"? I'll be addressing these issues in my next commentary in two weeks.
Have a great week!
The statements, opinions and projections made in this writing are for informational purposes and are my own. They do not represent the views of my broker/dealer. Additionally, this writing does not constitute an offer to sell, a solicitation to buy, or a recommendation regarding any securities transaction, or as an offer to provide advisory or other services by me or my broker/dealer in any jurisdiction in which such offer, solicitation, purchase or sale would be unlawful under the securities laws of such jurisdiction.
Warning! you can lose some or all of your principal (money) investing in stocks, bonds, ETFs, mutual funds, currencies, indexes, index or stock options, LEAPS and stock or commodity futures!
(click on chart for larger image)
As noted in the previous commentary, the "ascending triangle" (red dashed lines) was violated this week and I've targeted the the 20225 area for support. However, with Friday's price action a bullish candlestick pattern (a bullish engulfing pattern) has formed and I believe we are going to get a bounce from here. My confidence in this call is supported by the price action which reversed right on a Fibonacci support line (love those Fibonacci lines!). And, as we see the previous corrective patterns on the chart (blue arrows), leaving the October correction aside, the recent weakness can be seen as a "garden variety" pullback. It's always good to step back and "see the forest for the trees", especially with all the gut wrenching volatility we've experienced in the past few weeks.
Another reason why I believe the short term trend is now positive is because it appears that with Wednesday's surge in crude prices, oil may be consolidating at these levels. Here's a daily chart of West Texas Crude with the S&P500 below. I highlighted the point when the sell off in crude accelerated (red vertical line) and have lined the two charts up with a correlation coefficient in the bottom panel:
(click on chart for larger image)
The chart serves to show the strong correlation between the price of oil and equities over the past month. The correlation is really no surprise as any market watcher could glean this but it also tends to validate my thesis that to the extent oil consolidates, equities will stabilize and move higher.
Is the sell off in oil over? A lot of people are hoping but I'm not so sure. The geopolitical and economic fundamentals driven primarily by the Saudis tell me it is not. The Saudis can drive the price down to $20/barrel before it is unprofitable for them to pull it out of the ground. However, fiscally they need $77/barrel to maintain their economic and social programs in the country. They have already warned their population to tighten their belts. The Saudis are on a mission and are accomplishing two objectives simultaneously. They are hurting their enemies in that area of the world (Iran & Russia) and they are protecting their "swing producer" status be breaking the back of highly leveraged "frackers" in the US. And I don't believe their objective has been met yet. Another technical reason why I believe we will still see lower prices is the following chart:
(click on chart for larger image)
This is a weekly chart showing the spread between the price of Brent Crude and West Texas Crude. Historically, Brent has sold at a premium to West Texas over the past five years at $10/barrel. That spread is now less than $4.00. Without getting into details that some of my readers might not understand, the spread is a reflection of the supply in the market and with Brent so low as compared to West Texas, buyers are just as willing to buy Brent that's sitting offshore in oil tankers in the Gulf of Mexico as to buy it from domestic suppliers. This over hang of supply is not a good harbinger for the future price stability of "black gold".
With the short term trend higher there are still major challenges brewing this year which will have a profound effect on stocks.
Certainly, the message of Treasuries is that we are in the midst of a weakening global economy. Yields in this country are dropping like a rock since the new year began and although we've had some tepid economic numbers in this country over the past few weeks, with international economic challenges growing money is continuing to flow into the safe haven of Uncle Sam's debt, pushing Treasuries higher (with lower yields) and strengthening the US Dollar. Here's a seven year daily chart of the Ten Year US Treasury Yield. I've highlighted a few historical points to give my readers some perspective on where we're at:
(click on chart for larger image)
Here's an updated version of the US Dollar chart I posted two weeks ago:
(click on chart for larger image)
What's significant about the Dollar chart above is that it is a monthly chart. Moreover, the Dollar is cutting through multi year resistance like a hot knife through butter. Now, the month is not over and I suspect we may see some Dollar weakness going into a very eventful upcoming week (more on this below). Admittedly, in a technical sense I don't have much to hang my hat on in this regard but I sense there's going to be a lot of positioning in the currency market prior to the European Central Bank's upcoming meeting this Thursday, January 22nd. Here's the daily chart of the US Dollar and I circled the price action over the last week and a half:
(click on chart for larger image)
The price action reflected in the individual candlesticks speak to a slow down in the currency's steep rise. Ideally, I'd like to have other technical indicators corroborating my thesis but there is none to be found. So I may very well be wrong. We'll see ...
Speaking of currencies, the FOREX (foreign exchange) market was thrown into turmoil on Thursday when the Swiss National Bank decided to ditch a cornerstone of their monetary policy: "pegging the Euro" (1.20 Swiss Francs to one Euro). As the Swiss Franc soared and the chaos subsided, the surprise move shuttered a firm in New Zealand and FXCM, the largest retail currency trading firm had to scramble to seek emergency funding when $225 million in it's clients margin calls could not be met. Leucadia National finally threw them a $300 million lifeline so they could stay open. But the big winner in all this was:
(click on chart for larger image)
Gold had been consolidating and most traders thought it might be just a rest before another leg lower. And they still might very well be right. However, with the Swiss Franc now free floating against the Euro the safe haven status of the Swiss Franc is reaffirmed and the world's truly hard currency, gold, has broken out of a multi month downtrend as seen on the chart above of the SPDR Gold Trust Shares ETF (GLD), the popular trading vehicle for those traders/investors who do not want to trade the metal directly in the commodity market.
It will be important to monitor the price of gold here. This could be a false breakout. I'm not saying this because I have any antipathy towards gold. Some dear friends of mine (both here and departed) are "gold bugs". But soaring gold and a surging Dollar are not correlative in a deflationary environment which we find ourselves. True, gold fared well with a strong Dollar in the 1930's however, at that time the US government had pegged it's price at $35/ounce and it manifested it's strength through gold mining companies that traded at that time. We'll see where we go from here.
Finally, let's take a look at Emerging Markets. Here's a daily chart of the iShares MSCI Emerging Market ETF (EEM):
(click on chart for larger image)
EEM has been flirting with gap resistance for a number of weeks and because of this, I'm of the opinion that we will see a breakthrough here. Now, this thesis is incompatible with other inter market relationships that seem prevalent in the market but as I stated in my last commentary, traditional inter market relationships have been inconsistent recently. For a student of inter market relationships, it's sort of like flying blind. EEM's price action does not make sense to me in a deflationary world where the exporting economies of Asia and South America depend on the consumption of the developed countries of the West. So, a break out here would be very constructive for the global economic picture and if EEM is decisively turned away here it would reaffirm the deflationary stranglehold that appears to be taking over the planet.
ANALYSIS
The major event that will have an impact on stocks for at least the first half of this year is the upcoming ECB meeting on January 22nd. It is widely expected that the outcome of the meeting will be a significant policy change so that policymakers can stave off the deflationary spiral that is threatening the Euro zone. But deflation is already there:
(click on chart for larger image)
This is hardly the "shock and awe" that accompanied both the US and Japanese QE efforts. And there in lies the concerns market participants are starting to have and has been, in my opinion, an attendant reason for the market volatility the past few weeks.
First of all, there's a possible chance that there will be no announcement on Thursday, the 22nd. ECB President Mario Draghi made that clear in his last press conference. The announcement could come in June. But the chart above speaks for itself and, like inflation, waiting will only exacerbate the deflationary spiral. Many are arguing that it may already be too late to stem the tide.
Secondly, there is the important argument surrounding how effective sovereign bond purchases would be. Yields are already so low that the benefits in attempting to push them lower may not be worth it and may create other significant distortions that make the effort dangerous. After all, if the ECB buys the debt, who holds it? This is an ongoing debate in the ECB governing council and rumors persist that while the ECB will implement the policy the national banks will hold the debt. But in a deflationary environment national banks take on a dangerous exposure if the bond buying does not accomplish the goal of reflation. And then there's always the moral risk associated with these purchases which is behind the Germans main objection to this proposal.
Behind the German concerns and a huge part of the problem is the quiet recognition in the Euro area that monetary policy can only go so far in "kick starting" a recessionary economy and that fiscal policy must take over. But there is no will in the Euro zone, either among the Italians, French or the Germans to confront this issue. I cite in defense of this position the recent submission of France's national budget to the EU which was over the mandatory 3% deficit threshold. The result is that they went into "negotiations" with the EU on this budget and the whole issue was essentially glossed over.
I understand that issues are much more complex than stated above but these events underline the deeply flawed concept behind the EMU (European Monetary Union). Monetary union without fiscal/political union is untenable.
And so the Germans, which are the deep pockets over there, don't want to get caught holding the bag. And they have significant political sway in the ECB although they can be overruled.
So, whatever is announced on Thursday (if it is announced) is more likely to disappoint the market than to encourage it. Certainly a "shock and awe" surprise would be met with frenzied buying in the equity markets but no rational person can expect this outcome.
It's difficult to speculate the market reaction, especially with the focus on the price of oil (another deflationary beacon notwithstanding arguments that it's about oversupply). But I now believe the best outcome will be for the market to take the announcement in stride unless they postpone their decision.
If they postpone the decision things will probably get ugly. If they come in with $500 billion in sovereign purchases we're liable to see a rally but not of the magnitude I previously had predicted. After all, as stated above, they're at the point where they are confronting diminishing returns unless they go "all out"; buying anything and everything they can in the bond and debt markets. And for reasons stated above, they will not do that.
However, the market is wiser than any individual or entity engaged in it and anything can happen. The fact that inter market relationships are getting tricky and that emerging markets have been resilient in the face of significant volatility is encouraging to me.
There are also issues going on in Greece that I'm not too concerned with at this time but which must be watched. And it is becoming more apparent that the Fed's anticipated interest rate increases will be postponed until later in the year? Remember "Liquidity Traps Revisited"? I'll be addressing these issues in my next commentary in two weeks.
Have a great week!
The statements, opinions and projections made in this writing are for informational purposes and are my own. They do not represent the views of my broker/dealer. Additionally, this writing does not constitute an offer to sell, a solicitation to buy, or a recommendation regarding any securities transaction, or as an offer to provide advisory or other services by me or my broker/dealer in any jurisdiction in which such offer, solicitation, purchase or sale would be unlawful under the securities laws of such jurisdiction.
The information contained in this writing should not be construed as financial or investment advice on any subject matter. This writing is not published for the purpose of utilizing the information for short term trading or long term investing in stocks, bonds, ETFs, mutual funds,currencies, indexes, index or stock options, LEAPS, and stock or commodity futures. I expressly disclaim all liability in respect to actions taken based on any or all of the information on this writing. Seek the personal, face to face guidance of a registered investment advisor before entering any trade or investment. Anyone who trades or invests based on the information in this commentary does so at his/her own risk.
Warning! you can lose some or all of your principal (money) investing in stocks, bonds, ETFs, mutual funds, currencies, indexes, index or stock options, LEAPS and stock or commodity futures!
Subscribe to:
Posts (Atom)